How do NFL games impact crime rates?
Preface
This project was conducted using crime data gathered from primary government sources for 21 cities that are home to NFL teams. New York and Los Angeles were discounted from the beginning due to the presence of two teams in each city. This would have made it impossible to discern the impact of one team versus the other. The other seven teams that are not included were left out due to various factors, such as: incomplete data or a lack of access. I reached out to the relevant entities for each city in an effort to obtain this data, but as of writing, I have not received responses. This project may be updated in the future if my inquiries receive responses.
The goal of this project was to determine if NFL games impacted crime rates and if that impact would change between cities.
Challenges
In addition to the 7 cities that data could not be obtained for, there are a few other challenges that were encountered.
Holidays affect crime data. For most teams and holidays, this was accounted for and weights were applied when calculating expected crime rates. However, for the Dallas Cowboys and the Detroit Lions, there was no way to accurately weigh the data for Thanksgiving. This is because both of these teams play on Thanksgiving every season. Due to this problem, the Thanksgiving games were dropped from the data for both teams.
This project was performed using as much historic data that was available for creating the weights used to calculate expected crime rates. The game data, however, is only for the 2022 NFL season. This limits the total amount of available data for teams to the number of games they played in the season. Further research could be performed using more years, depending on the available data.
There are a large number of factors that can impact crime rates outside of the NFL games. While expected crime rates were calculated using crime rates of days surrounding the target date, there are still factors that can impact single days, such as weather, that are not accounted for here.
Methodology
Results
As previously mentioned, the data was collected from various official sources (usually a cities OpenData portal). While there are variations to how each city recorded and measured their crime rates, each city that was used contained the necessary data: dates and crimes.
Each city dataset that was separated by year was appended together into a master file. After this, each dataset was cleaned down to the barebones requirements and columns were renamed to match. Once these cleaned master files were verified, crimes were grouped by date and the data was ready.
Excel charts were made for each team to hold the necessary season data (see team charts below).
Expected crime rate calculation
Using historic crime data (years available varied by city), crime rates for each city by day of week was calculated. This varied slightly by city, so this was recalculated for each city. These rates by day of week were used to create weights for each day of the week.
Using these day of week weights, actual crime rates for the other six days of the week surrounding the target game day were added together and used to calculate expected crime rate for the target date.
In cases where two games were played within one week (i.e. Sunday and Thursday) or a holiday occurred during the surrounding week, the next closest date that fell on the same day of the week would be used.
Due to the impact of holidays on crime rates, games that occurred on holidays were calculated separately using a similar method as regular games, but with weights created using historic data for holidays and the surrounding dates.
Data Measured
Team
Date
Home/Away
Opponent
Rival (Y/N) *This only measured divisional rivals and did not include more arbitrary rivalries, such as Russell Wilson with Denver against Seattle.
Game Start Time
Win/Loss
Expected Crime Rate
Actual Crime Rate
All visualizations were created using Microsoft Power BI after all 21 charts were appended together into a master file.
All results were measured using percentage differences between expected and actual crime rates to account for variance in crime data collection by city and city population.
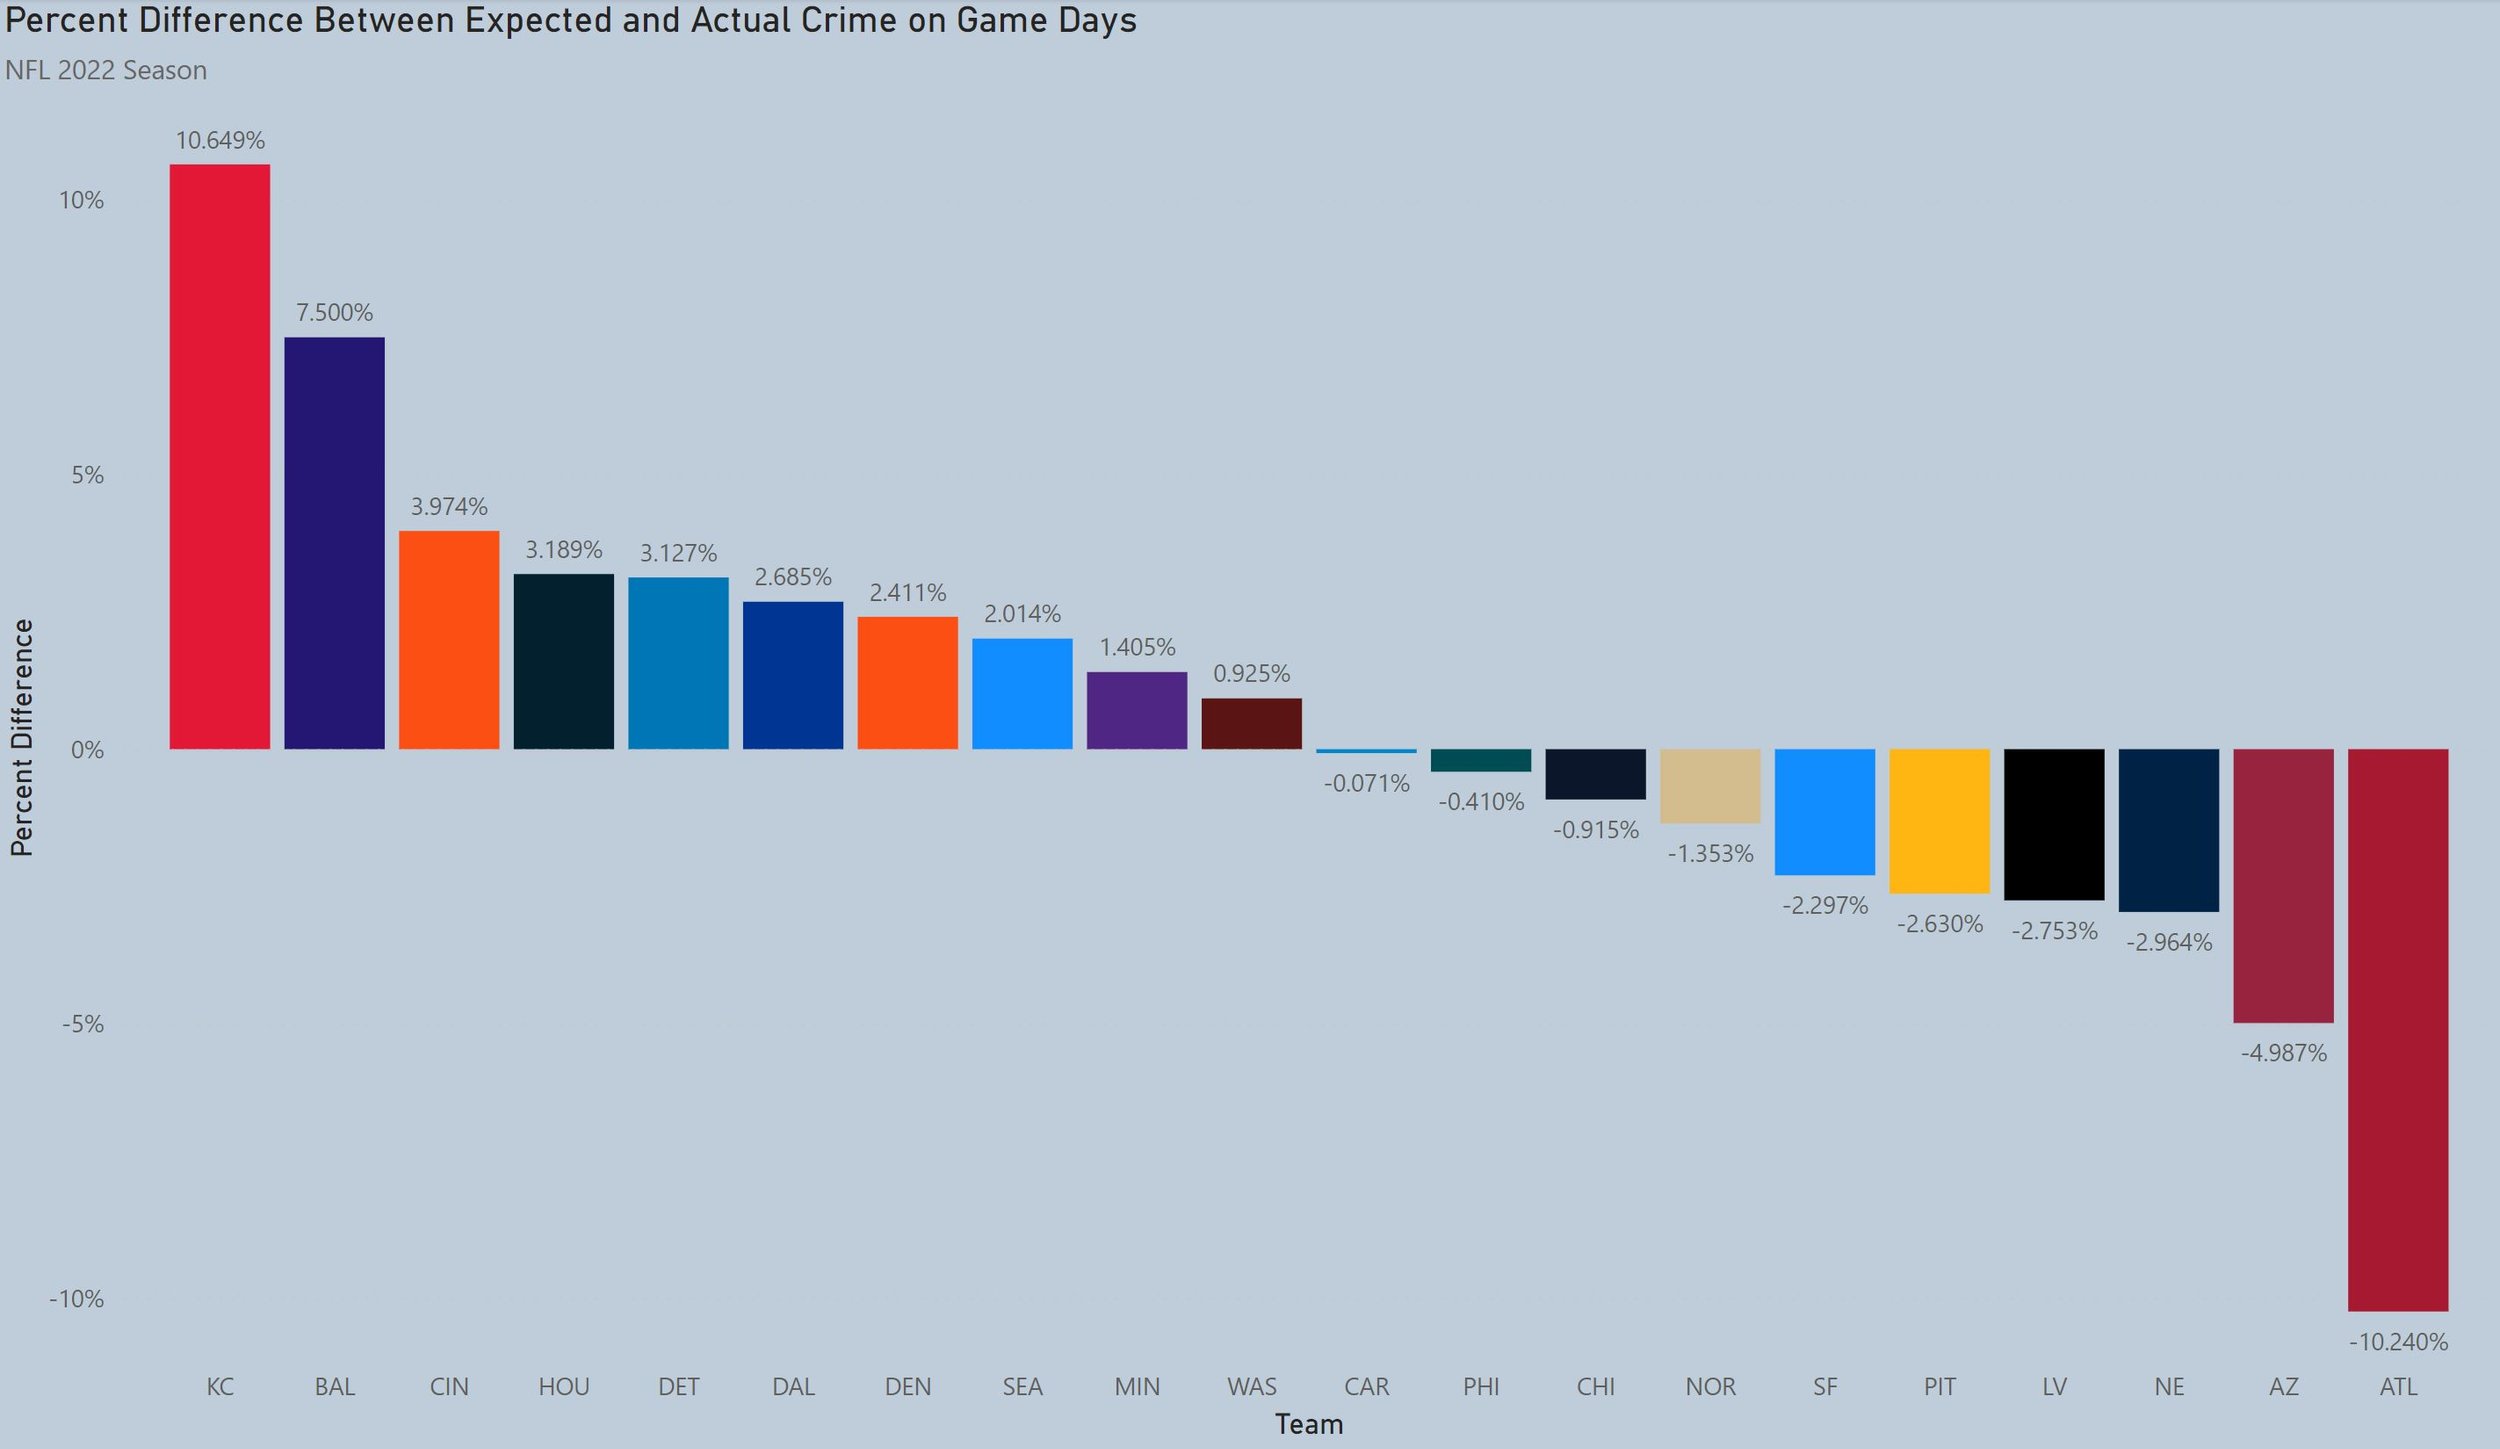
On a team basis, Kansas City had the highest increase in crime on game days and Atlanta had the greatest decrease.

The above chart measures crime in cities when they play against the charted teams. Crime increased the most when teams played against Kansas City and decreased the most when teams played against New England.
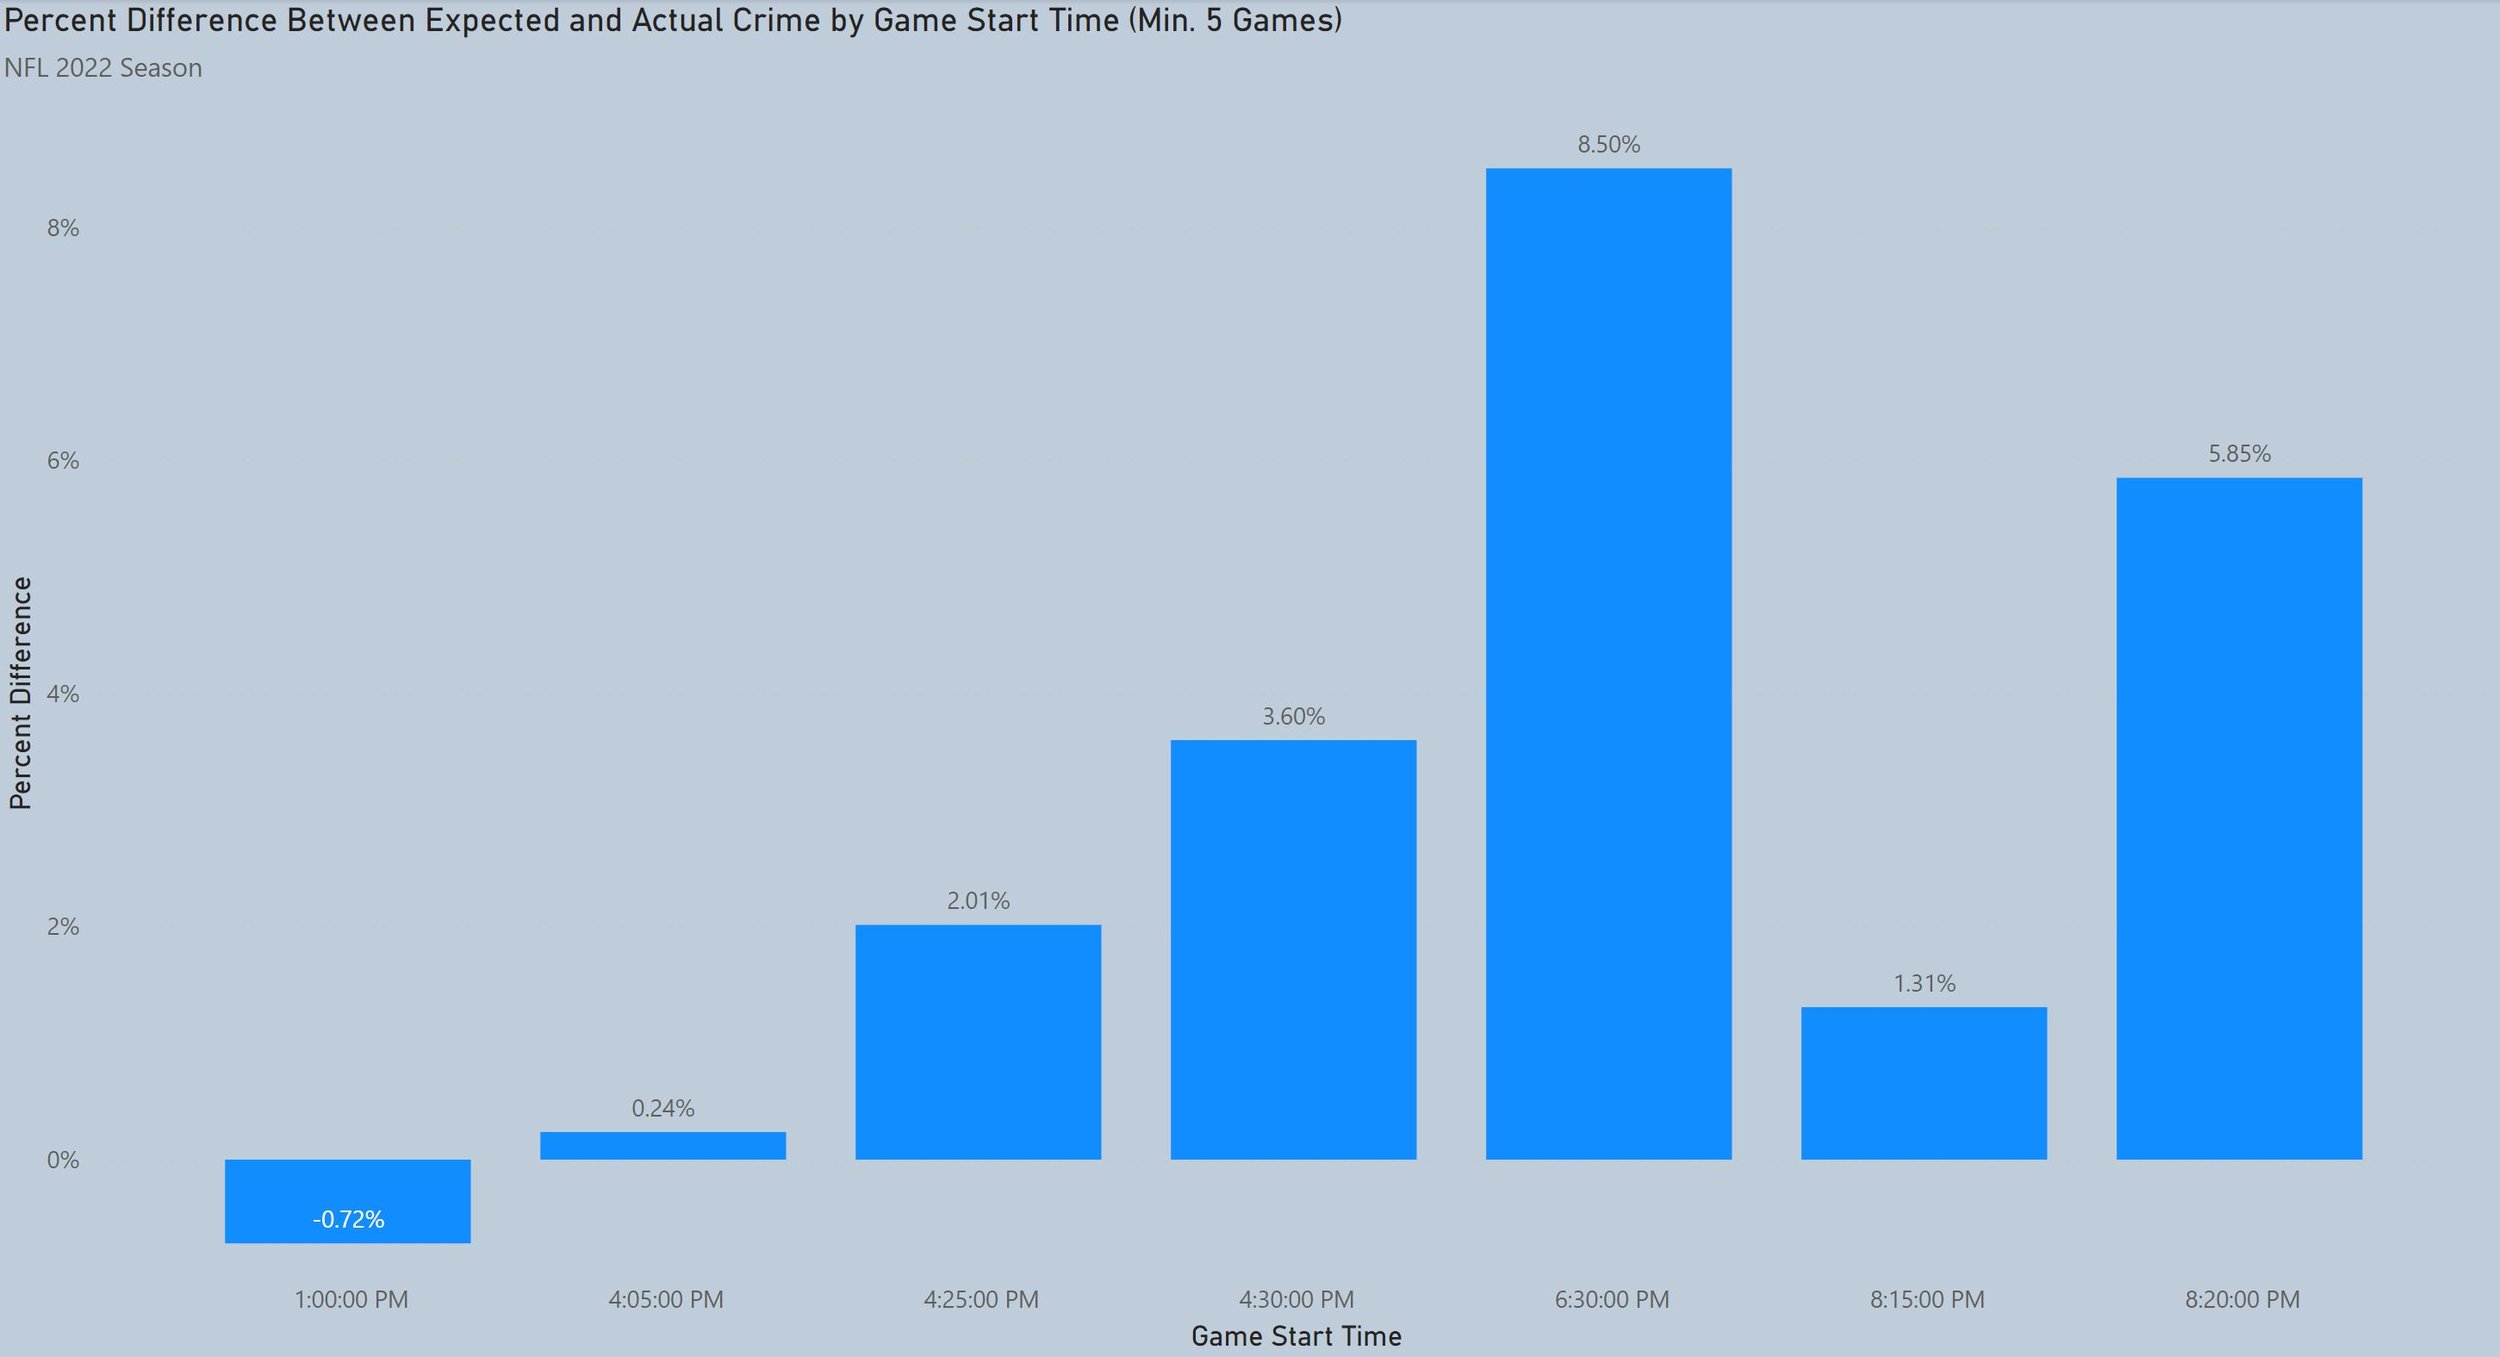
1:00 PM games were the only time slot that yielded a decrease in crime. All prime time slots had an overall increase.
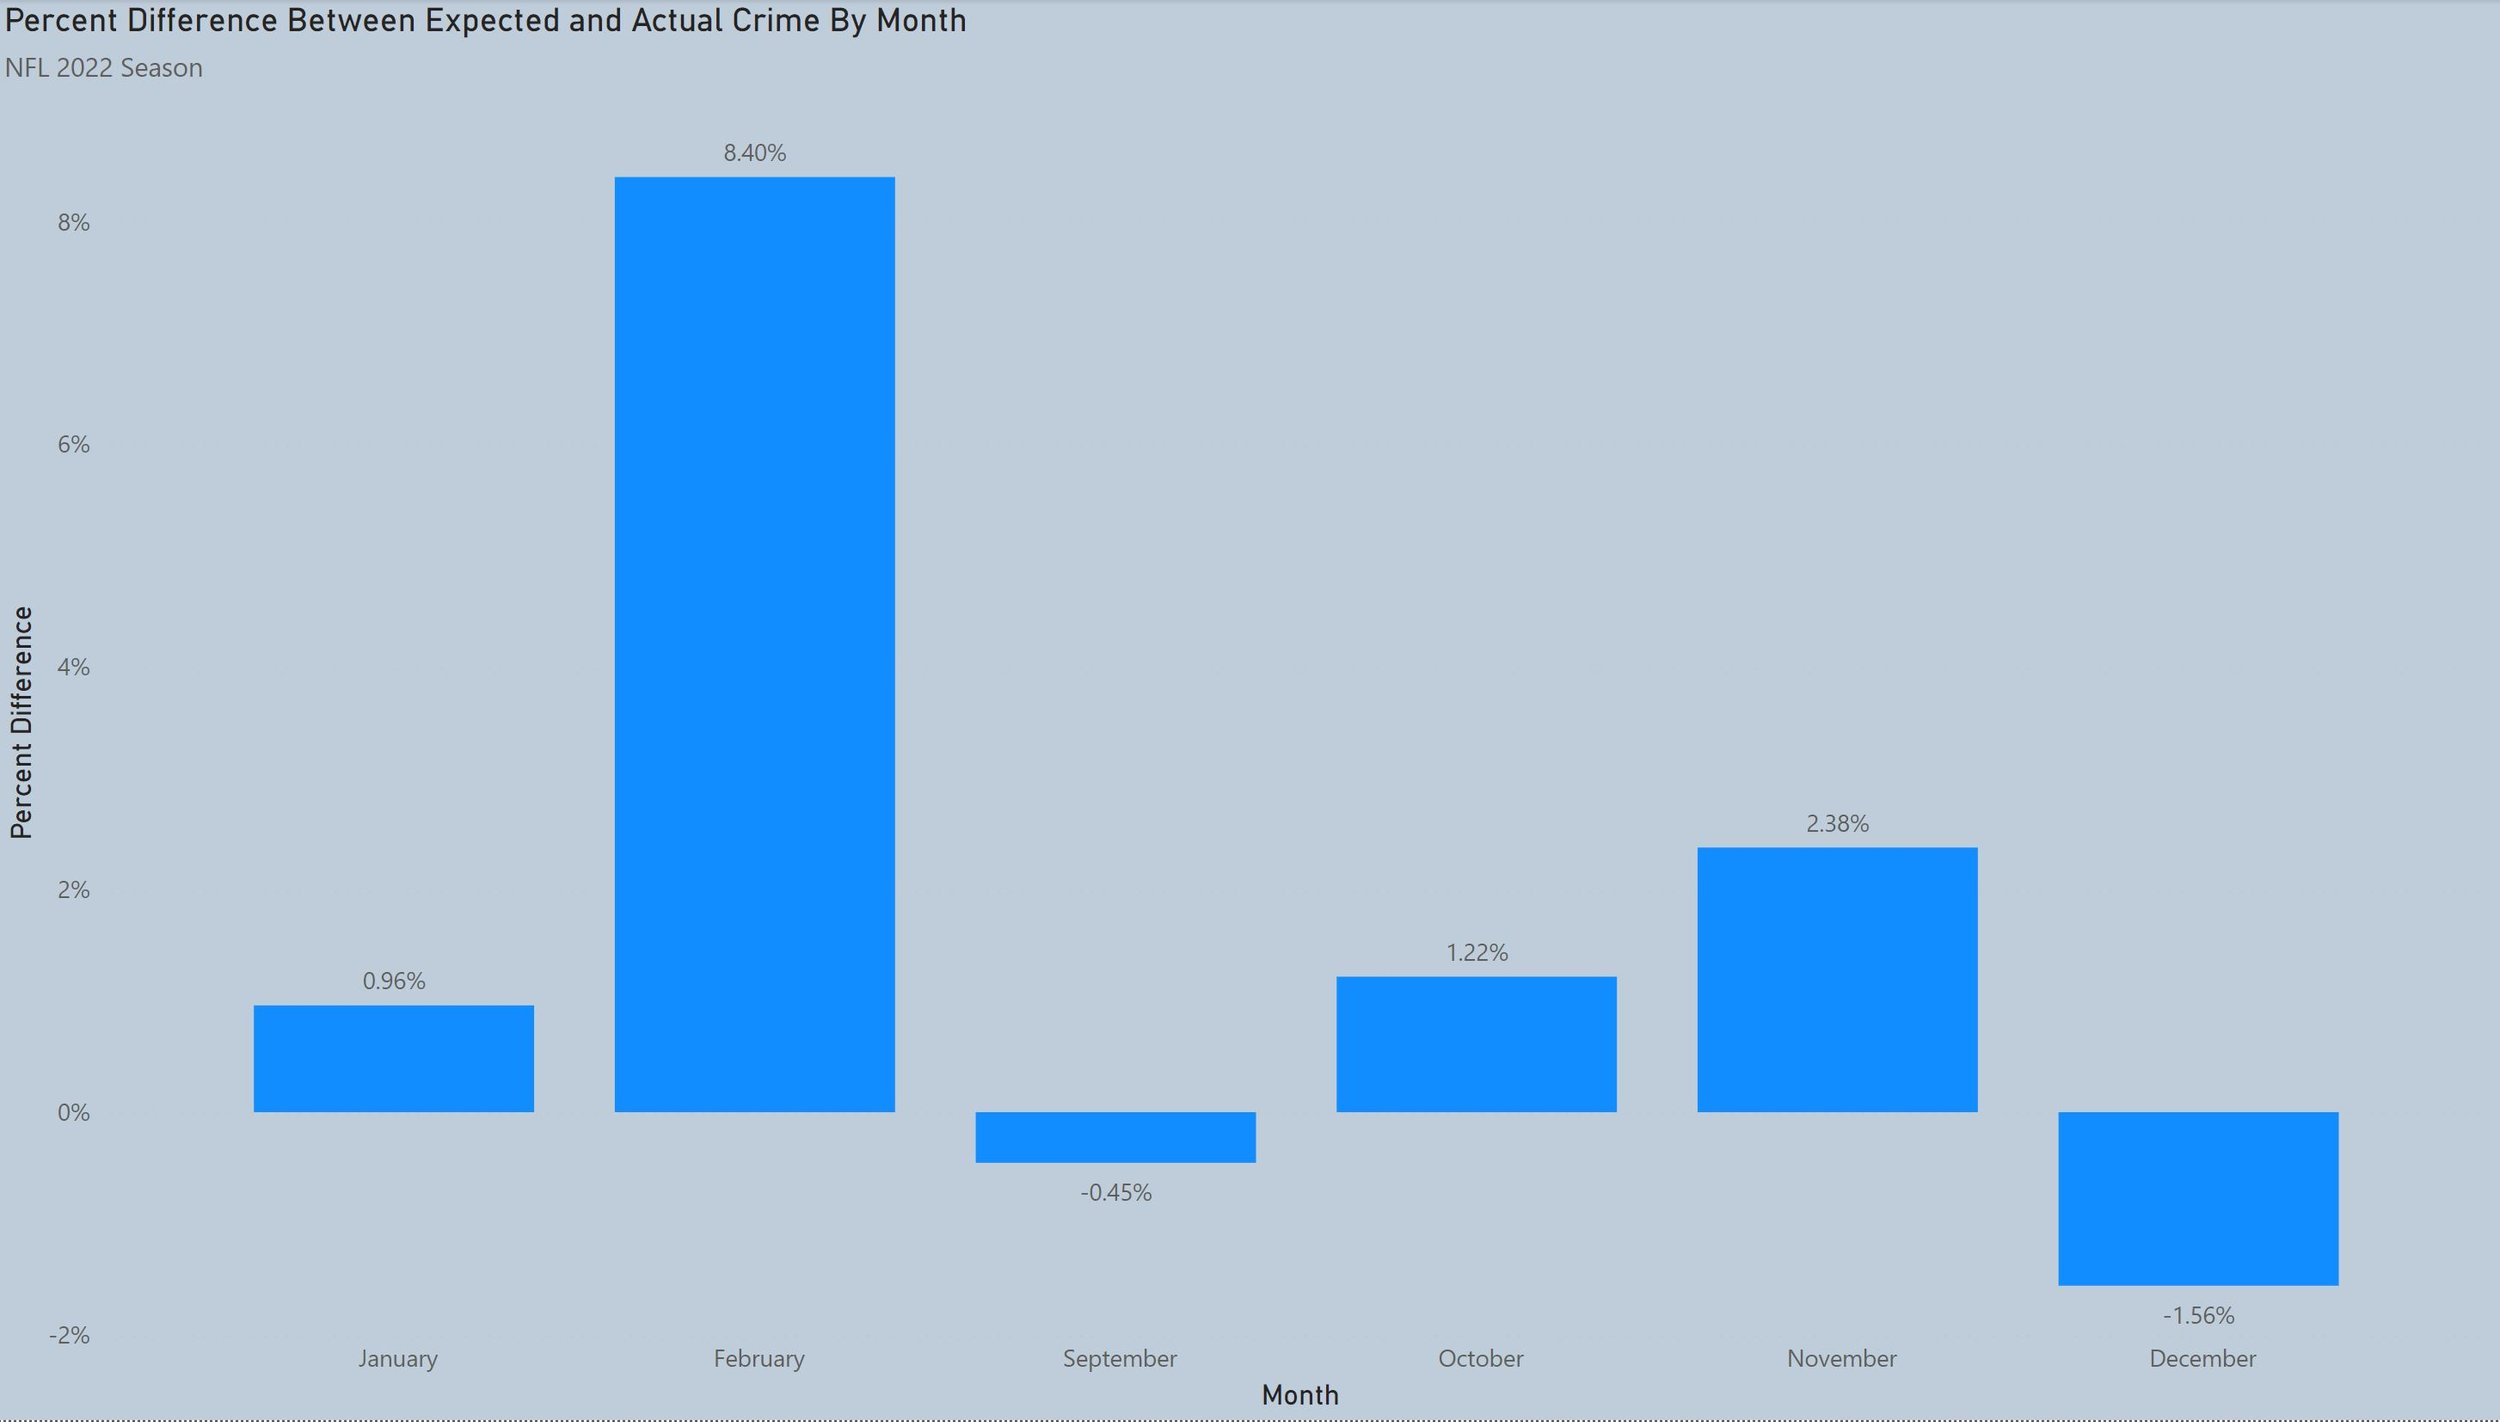
September and December resulted in decreases in crime, while the other months resulted in increases. Note that only one game (Super Bowl) occurs in February.
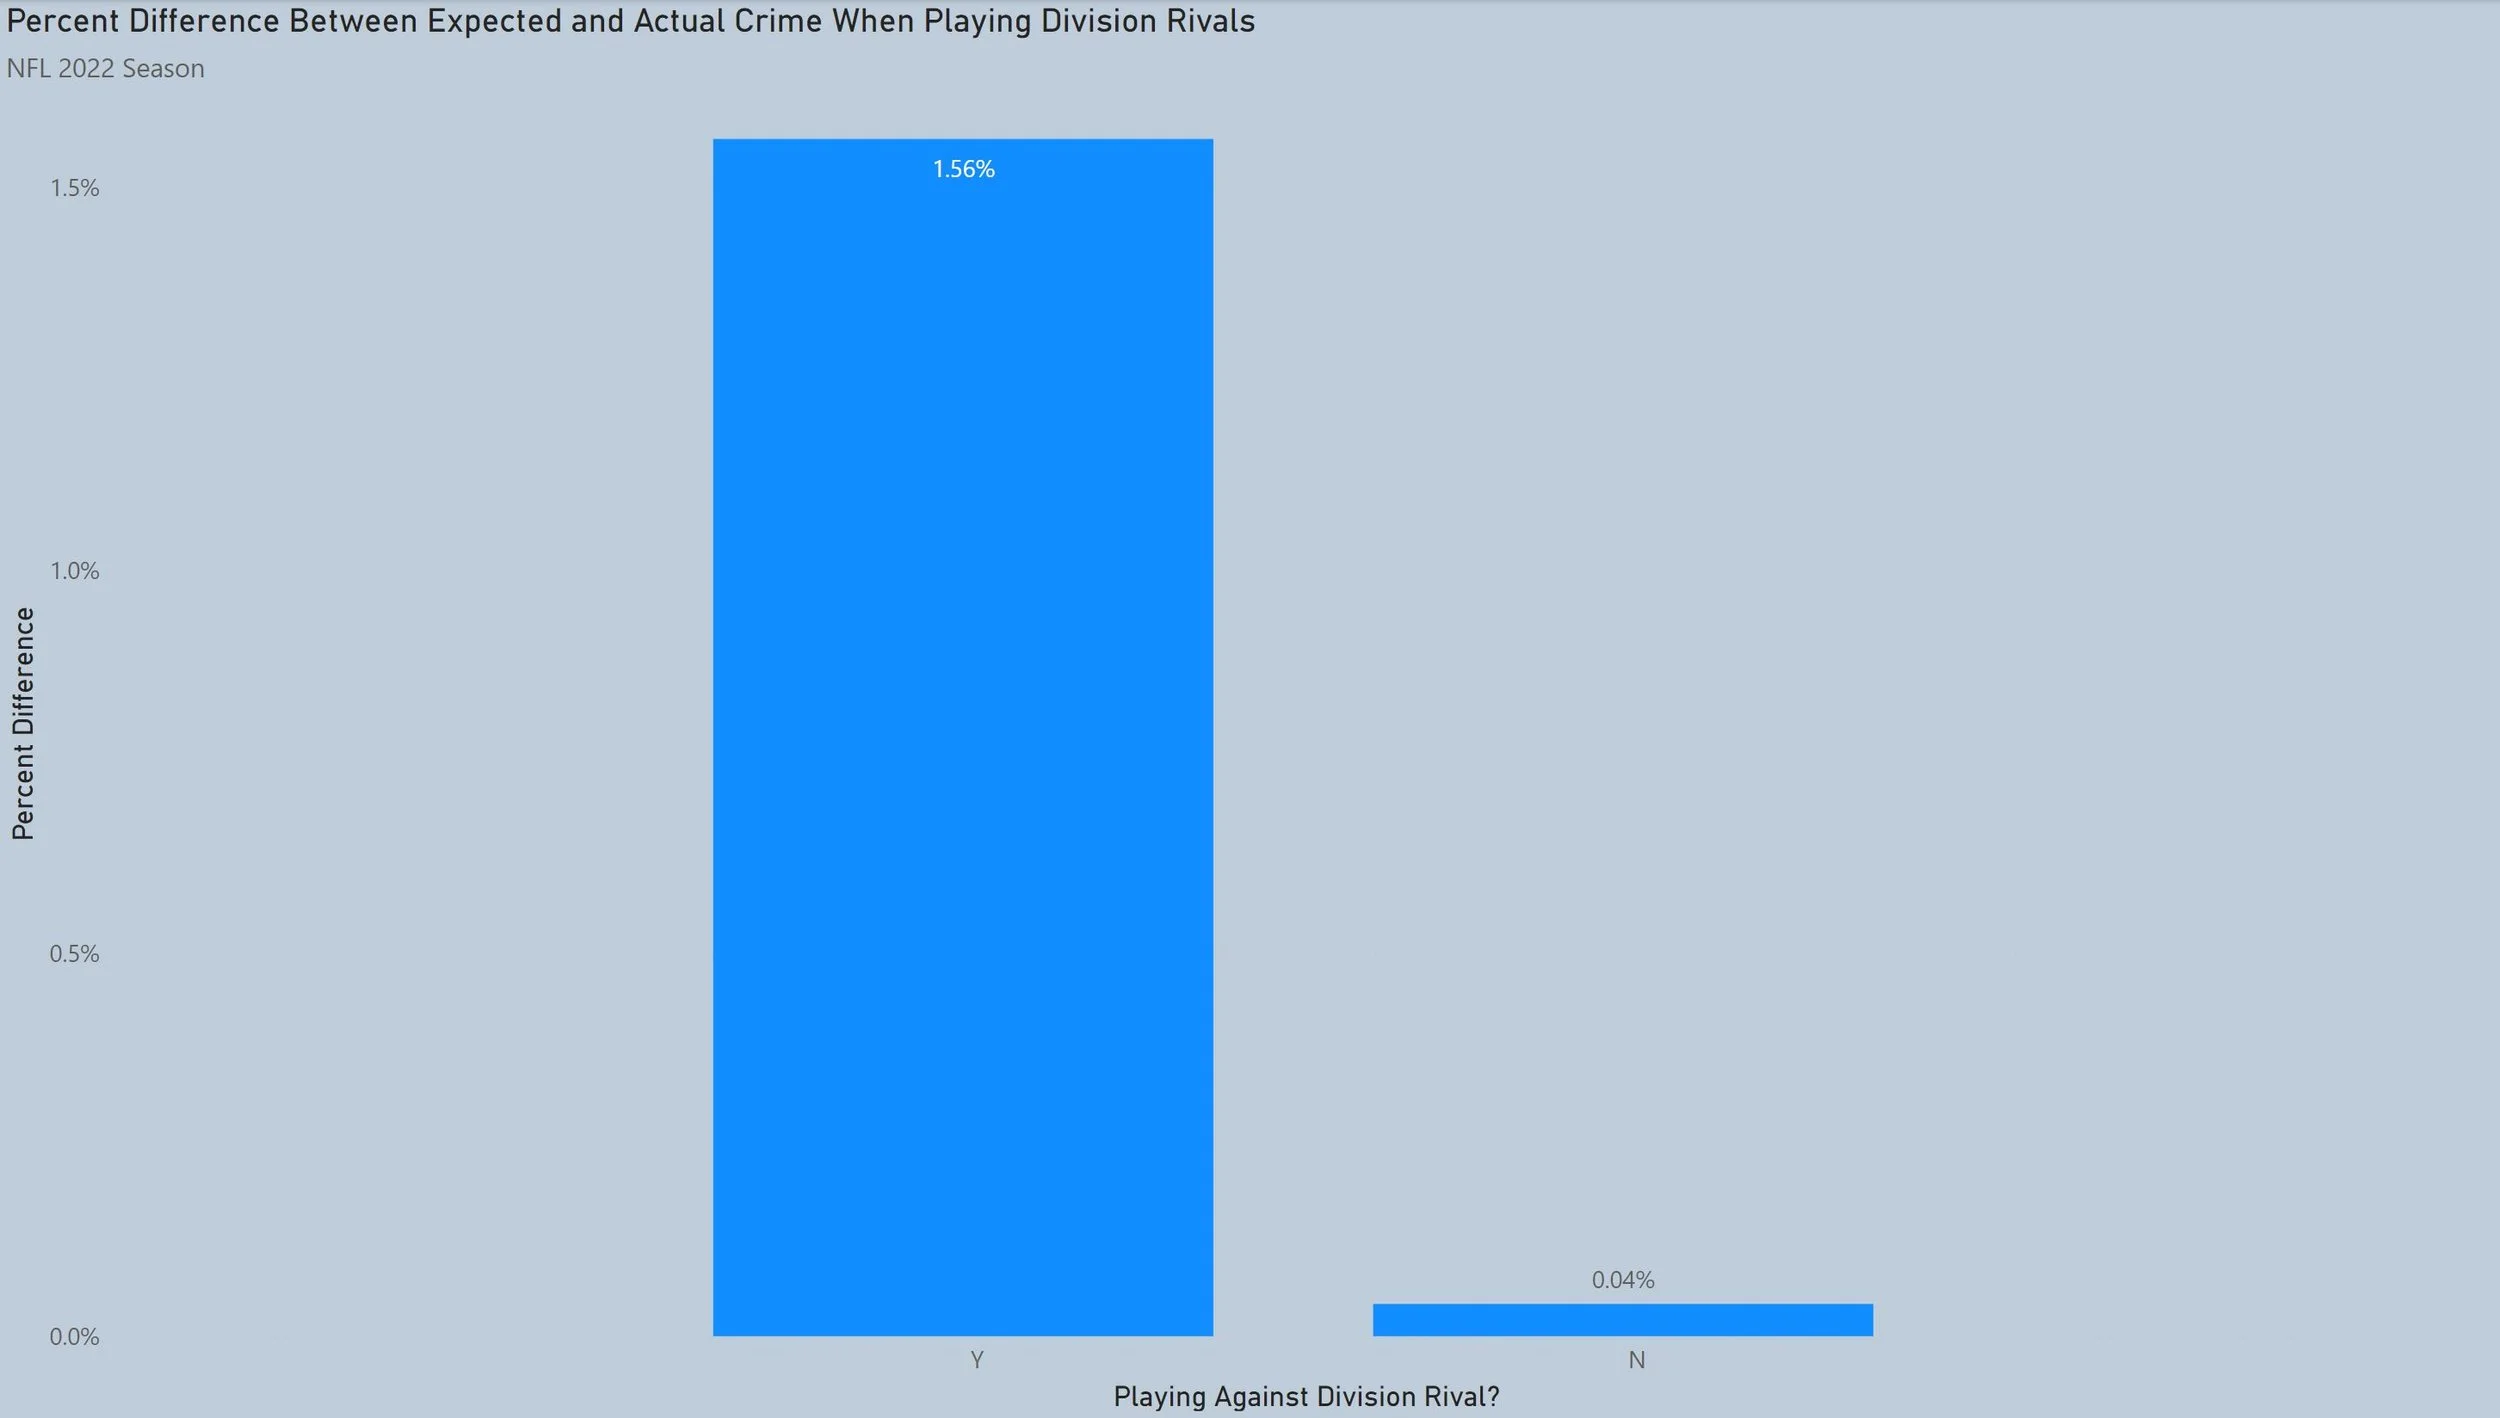
Playing against divisional rivals resulted in a 1.56% increase in crime, while games against other opponents only had a negligible .04% increase.

Similar to the rival games, home games resulted in a 1.12% increase, while away games had a negligible increase of .03%.

There was effectively no difference in crime based on whether teams won or lost a game.

In line with the Win/Lose chart, outside of the outliers of Kansas City and Atlanta, there was no significant trend in crime rate difference based on a team’s regular season record.
Conclusions
Based on the data presented, it does not appear that NFL games have a significant impact on crime rates overall. However, based on the variations between cities, it may be worth further investigation if this may be true for specific cities. Given that this project was only performed using games played during the 2022 NFL season, each city only has 17-20 games to pull data from. This allows outliers to impact the data fairly heavily. Further research would need to be performed using data from several NFL seasons.
Two things that may also be worth noting is that home games and games against divisional rivals yielded higher differences. It may be worth further digging in the data to see what percentage of crimes that occur during home games occur at or near the stadium (perhaps drunk fans are getting a little too wild during the game).
Interesting Anecdotes
Of all 21 cities used in this project, Boston had the biggest decrease in crime on all Sundays. Perhaps there is research out there that explains this, such as a look into the influence of a large Catholic population in Boston.
As mentioned earlier, holidays have a significant impact on crime rates. However, in Baltimore, there was no significant decrease in crime on the major holidays that were looked at. It is unclear at this time why that is the case.
Philadelphia recorded its highest number of crimes in a single day (588) in the winter the day after their Super Bowl loss to Kansas City since at least 2015 (this is the cutoff year for the data that was used).